Categories
r2013 notes

ME6602 Notes Automobile Engineering Regulation 2013 Anna University

ME6602 Notes Automobile Engineering

ME6602 Notes Automobile Engineering Regulation 2013 Anna University free download. Automobile Engineering Notes free pdf download.

OBJECTIVES ME6602 Notes:

To understand the construction and working principle of various parts of an automobile.

To have the practice for assembling and dismantling of engine parts and transmission system.

OUTCOMES ME6602 Notes:

Upon completion of this course, the students will be able to identify the different components in automobile engineering.

Have clear understanding on different auxiliary and transmission systems usual.

TEXT BOOKS ME6602 Notes:

1. Kirpal Singh, “Automobile Engineering”, Vol 1 & 2, Seventh Edition, Standard Publishers, New Delhi, 1997.

2. Jain K.K. and Asthana .R.B, “Automobile Engineering” Tata McGraw Hill Publishers, New Delhi, 2002.

REFERENCES ME6602 Notes:

1. Newton ,Steeds and Garet, “Motor Vehicles”, Butterworth Publishers,1989.

2. Joseph Heitner, “Automotive Mechanics,” Second Edition, East-West Press, 1999.

3. Martin W, Stockel and Martin T Stockle , “Automotive Mechanics Fundamentals,” The Good heart –Will Cox Company Inc, USA ,1978.

4. Heinz Heisler, “Advanced Engine Technology,” SAE International Publications USA, 1998.

5. Ganesan V. “Internal Combustion Engines”, Third Edition, Tata McGraw-Hill, 2007.

The following main components of the Chassis are

1. Frame: it is made up of long two members called side member riveted together with the help of number of cross members.

2. Engine or Power plant: It provides the source of power

3. Clutch: It connects and disconnects the power from the engine fly Wheel to the transmission system.

4. Gear Box 5.U Joint 6. Propeller Shaft 7. Differential

FUNCTIONS OF THE CHASSIS FRAME:

1. To carry load of the passengers or goods carried in the body.

2. To support the load of the body, engine, gear box etc.,

3. To withstand the forces caused due to the sudden braking or acceleration.

4. To withstand the stresses caused due to the bad road condition.

5. To withstand centrifugal force while cornering.

Subject Name Automobile Engineering
Subject Code ME6602
Regulation 2013
File PDF

ME6602 Notes click here to download

Automobile Engineering Syllabus


Automobile Engineering Important Questions


ME6602 Questions Bank

Categories
UG syllabus R 2013

ME6602 Syllabus Automobile Engineering Regulation 2013 Anna University

ME6602 Syllabus Automobile Engineering

ME6602 Syllabus Automobile Engineering Regulation 2013 Anna University free download. Automobile Engineering Syllabus free pdf download.

UNIT I VEHICLE STRUCTURE AND ENGINES ME6602 Syllabus

Types of automobiles, vehicle construction and different layouts, chassis, frame and body, Vehicle aerodynamics (various resistances and moments involved), IC engines –componentsfunctions and materials, variable valve timing (VVT).

UNIT II ENGINE AUXILIARY SYSTEMS ME6602 Syllabus

Electronically controlled gasoline injection system for SI engines, Electronically controlled diesel injection system (Unit injector system, Rotary distributor type and common rail direct injection system), Electronic ignition system (Transistorized coil ignition system, capacitive discharge ignition system), Turbo chargers (WGT, VGT), Engine emission control by three way catalytic converter system, Emission norms (Euro and BS).

UNIT III TRANSMISSION SYSTEMS ME6602 Syllabus

Clutch-types and construction, gear boxes- manual and automatic, gear shift mechanisms, Over drive, transfer box, fluid flywheel, torque converter, propeller shaft, slip joints, universal joints ,Differential and rear axle, Hotchkiss Drive and Torque Tube Drive.

UNIT IV STEERING, BRAKES AND SUSPENSION SYSTEMS ME6602 Syllabus

Steering geometry and types of steering gear box-Power Steering, Types of Front Axle, Types of Suspension Systems, Pneumatic and Hydraulic Braking Systems, Antilock Braking System (ABS), electronic brake force distribution (EBD) and Traction Control.

UNIT V ALTERNATIVE ENERGY SOURCES Automobile Engineering Syllabus

Use of Natural Gas, Liquefied Petroleum Gas, Bio-diesel, Bio-ethanol, Gasohol and Hydrogen in Automobiles- Engine modifications required –Performance, Combustion and Emission Characteristics of SI and CI engines with these alternate fuels – Electric and Hybrid Vehicles, Fuel Cell Note: Practical Training in dismantling and assembling of Engine parts and Transmission Systems should be given to the students.

Subject Name Automobile Engineering
Subject Code ME6602
Regulation 2013
File PDF

ME6602 Syllabus click here to download

ME6602 Notes


Automobile Engineering Important Questions


ME6602 Questions Bank

Categories
question bank

ME6601 Questions Bank Design of Transmission Systems Regulation 2013 Anna University

ME6601 Questions Bank Design of Transmission Systems

ME6601 Questions Bank Design of Transmission Systems Regulation 2013 Anna University free download. Design of Transmission Systems Questions Bank free pdf download.

Sample ME6601 Questions Bank:

PART- A (2 Marks)

1. Give the relationship of ratio of tensions in a V-belt drive.

2. Define maximum tension in a belt.

3. What is the effect of centre distance and diameter of pulley on the life of belts?

4. What are the various losses in the power transmission by belts?

5. In what way the timing belt is superior to ordinary belt?

6. Why V belts are preferred than flat belts?

7. Define creep in belts.

8. What is the advantage of V belt over flat belt?

9. Define slip.

10. Distinguish regular lay and long lay ropes.

11. Give some application of wire ropes.

12. In what way silent chain is better than ordinary driving chain?

13. What do you understand by simplex, duplex and triplex chain?

14 .Explain the chordal action of chain drive.

15. Explain the term “Crowning of Pulley”.

PART-B (16 Marks)

1. A workshop crane is lifting a load of 25kN through a wire rope and a hook. Te weight of the hook etc is 15kN. The rope drum diameter may be taken as 30 times the diameter of the rope. The load is to be lifted with an acceleration of 1 m/s2.Calculate the diameter of the wire rope. Take a factor of safety of 6 and Young’s modulus for the wire rope 80 kN/mm2. The ultimate stress may be taken as 1800 MPa. The cross-sectional area of the wire rope may be taken as 0.38 times the square of the wire rope diameter.

Subject Name Design of Transmission Systems
Subject Code ME6601
Regulation 2013
File PDF

ME6601 Questions Bank click here to download

Design of Transmission Systems Syllabus


ME6601 Notes


Design of Transmission Systems Important questions


ME6601 Question Bank

Categories
Important question

ME6601 Important Questions Design of Transmission Systems Regulation 2013 Anna University

ME6601 Important Questions Design of Transmission Systems

ME6601 Important Questions Design of Transmission Systems Regulation 2013 Anna University free download. Design of Transmission Systems Important Questions free pdf download.

Sample ME6601 Important Questions:

1. What is a power drive? Mention their types.
The power drive is a set of machine members employed to transmit power or energy produced in one machine member to another machine. Their main types are (1) Mechanical drives, (2) Hydraulic drives, (3) Pneumatic drives and (4) Electrical drives.

2. Why tight side of the belt should be at the bottom side of the pulley?
If the tight side is at the bottom side of the pulley and the slack side is at the top side, then sag caused by the self-weight of the belt, for long center distance drive will increase the arc of contact of the belt with pulley and hence the effect of power transmission is increased.

3. What are the factors influencing the coefficient of friction between belt & pulley?
(1) Belt material,
(2) Pulley material,
(3) The slip of the belt,
(4) The speed of the belt.

4. What is meant by angle of contact?
The angle of contact is the angle made by a common normal drawn to the tangent line at the point of engagement and at the point of disengagement of the belt on a pulley, at its centre. It is also known as lap angle, wrap angle.

5. Name four types of belts.
1. Flat belts 2.V- belts 3.Ribbed belts 4.Toothed timing belts

6. What are the materials used for belt drives?
1.Leather 2.fabric and cotton 3.Rubber 4.Balata 5.Nylon

Subject Name Design of Transmission Systems
Subject Code ME6601
Regulation 2013
File PDF

ME6601 Important Questions 1 click here to download

ME6601 Important Questions 2 click here to download


Design of Transmission Systems Syllabus


ME6601 Notes


Design of Transmission Systems Important questions


ME6601 Question Bank

Categories
UG syllabus R 2013

ME6601 Syllabus Design of Transmission Systems Regulation 2013 Anna University

ME6601 Syllabus Design of Transmission Systems

ME6601 Syllabus Design of Transmission Systems Regulation 2013 Anna University free download. Design of Transmission Systems Syllabus free pdf download.

UNIT I DESIGN OF FLEXIBLE ELEMENTS ME6601 Syllabus

Design of Flat belts and pulleys – Selection of V belts and pulleys – Selection of hoisting wire ropes and pulleys – Design of Transmission chains and Sprockets.

UNIT II SPUR GEARS AND PARALLEL AXIS HELICAL GEARS ME6601 Syllabus

Speed ratios and number of teeth-Force analysis -Tooth stresses – Dynamic effects – Fatigue strength – Factor of safety – Gear materials – Design of straight tooth spur & helical gears based on strength and wear considerations – Pressure angle in the normal and transverse plane- Equivalent number of teeth-forces for helical gears.

UNIT III BEVEL, WORM AND CROSS HELICAL GEARS Design of Transmission Systems Syllabus

Straight bevel gear: Tooth terminology, tooth forces and stresses, equivalent number of teeth.Estimating the dimensions of pair of straight bevel gears. Worm Gear: Merits and demeritsterminology. Thermal capacity, materials-forces and stresses, efficiency, estimating the size of the worm gear pair. Cross helical: Terminology-helix angles-Estimating the size of the pair of cross helical gears.

UNIT IV GEAR BOXES ME6601 Syllabus

Geometric progression – Standard step ratio – Ray diagram, kinematics layout -Design of sliding mesh gear box – Design of multi speed gear box for machine tool applications – Constant mesh gear box – Speed reducer unit. – Variable speed gear box, Fluid Couplings, Torque Converters for automotive applications.

UNIT V CAMS, CLUTCHES AND BRAKES ME6601 Syllabus

Cam Design: Types-pressure angle and under cutting base circle determination-forces and surface stresses. Design of plate clutches –axial clutches-cone clutches-internal expanding rim clutches- Electromagnetic clutches. Band and Block brakes – external shoe brakes – Internal expanding shoe brake.

Subject Name Design of Transmission Systems
Subject Code ME6601
Regulation 2013
File PDF

ME6601 Syllabus click here to download

Design of Transmission Systems Syllabus


ME6601 Notes


Design of Transmission Systems Important questions


ME6601 Question Bank

Categories
r2013 notes

ME6601 Notes Design of Transmission Systems Regulation 2013 Anna University

ME6601 Notes Design of Transmission Systems

ME6601 Notes Design of Transmission Systems Regulation 2013 Anna University free download. Design of Transmission Systems Notes free pdf download.

OBJECTIVES ME6601 Notes:

To gain knowledge on the principles and procedure for the design of Mechanical power Transmission components.

Understand the standard procedure available for Design of Transmission of Mechanical
elements

To learn to use standard data and catalogues (Use of P S G Design Data Book permitted)

OUTCOMES ME6601 Notes:

• Upon completion of this course, the students can able to successfully design transmission
components used in Engine and machines

TEXT BOOKS ME6601 Notes:

1. Bhandari V, “Design of Machine Elements”, 3rd Edition, Tata McGraw-Hill Book Co, 2010.

2. Joseph Shigley, Charles Mischke, Richard Budynas and Keith Nisbett “Mechanical
Engineering Design”, 8th Edition, Tata McGraw-Hill, 2008.

REFERENCES ME6601 Notes:

1. Sundararajamoorthy T. V, Shanmugam .N, “Machine Design”, Anuradha Publications, Chennai, 2003.

2. Gitin Maitra, L. Prasad “Hand book of Mechanical Design”, 2nd Edition, Tata McGraw-Hill, 2001.

3. Prabhu. T.J., “Design of Transmission Elements”, Mani Offset, Chennai, 2000.

4. C.S.Sharma, Kamlesh Purohit, “Design of Machine Elements”, Prentice Hall of India, Pvt. Ltd., 2003.

5. Bernard Hamrock, Steven Schmid, Bo Jacobson, “Fundamentals of Machine Elements”, 2nd Edition, Tata McGraw-Hill Book Co., 2006.

6. Robert C. Juvinall and Kurt M. Marshek, “Fundamentals of Machine Design”, 4th Edition, Wiley, 2005

7. Alfred Hall, Halowenko, A and Laughlin, H., “Machine Design”, Tata McGraw-Hill BookCo.(Schaum’s Outline), 2010

8. Orthwein W, “Machine Component Design”, Jaico Publishing Co, 2003.

9. Ansel Ugural, “Mechanical Design – An Integral Approach”, 1st Edition, Tata McGraw-Hill Book Co, 2003.

10. Merhyle F. Spotts, Terry E. Shoup and Lee E. Hornberger, “Design of Machine Elements” 8th Edition, Printice Hall, 2003.

11. U.C.Jindal : Machine Design, “Design of Transmission System”, Dorling Kindersley, 2010.

Subject Name Design of Transmission Systems
Subject Code ME6601
Regulation 2013
File PDF

ME6601 Notes click here to download

Design of Transmission Systems Syllabus


ME6601 Notes


Design of Transmission Systems Important questions


ME6601 Question Bank

Categories
Uncategorized

FLOOD ROUTING

FLOOD ROUTING

FLOOD ROUTING – The stage and discharge hydrographs represent the passage of waves of river depth and discharge respectively.

As this wave moves down the river, the shape of the wave gets modified due to various factors, such as channel storage, resistance, lateral addition or withdrawal of flows, etc.

When a flood wave passes through a reservoir, its peak is attenuated and the time base is enlarged due to the effect of storage.

Flood waves passing down a river have their peaks attenuated due to friction if there is no lateral inflow.

The addition of lateral inflows can cause a reduction of attenuation or even amplification of a flood wave.

Flood routing is the technique of determining the flood hydrograph at a section of a river by utilizing the data of flood flow at one or more upstream sections.

The hydrologic analysis of problems such as flood forecasting, flood protection, reservoir design  and spill design  invariably include  flood routing.

In these applications  two broad categories of routing can be recognised.

These are:

Reservoir routing

Channel routing

In reservoir routing the effect of a flood wave entering a reservoir is studied. Knowing the  volume — elevation  characteristic  of  the  reservoir  and  the  outflow — elevation relationship for the spillways and other outlet structures in the reservoir, the effect of a flood wave entering the reservoir is studied to predict the! variations of reservoir elevation and outflow discharge with time.

This form of reservoir routing is essential (i) in the design of the capacity of spill and other) reservoir outlet structures and (ii) in the location and sizing of the capacity of reservoirs to meet specific requirements.

In channel routing  the change  in the  shape  of a hydrograph  as it travels  down a channel is studied.

By considering a channel reach and an input hydrograph at the upstream end, this form of routing aims to predict the flood hydrograph at various

sections of the reach. Information on the flood-peak attenuation and the duration of levels obtained by channel routing is of utmost importance in ‘ operations and flood- protection works.

A variety of routing methods are available and they can be broadly classified into two categories as: (i) hydrologic routing and (ii) hydraulic routing. 0 methods employ essentially the equation of continuity.

Hydraulic methods, on the other hand, employ the continuity equation  together with the equation of motion of unsteady flow-

The basic  differential  equations  used  in  the  hydraulic  routing,  known  as  St.Venant equations afford a better description of flow than hydrologic methods.

HYDROLOGICAL STORAGE ROUTING (LEVELPOOL ROUTING)

A flood wave 1(t) enters a reservoir Provided with an outlet such as a spill Way T outflow is a function of the reservoir elevation only, i.e. Q =Q (h).

The Storage in the reservoir is a function of the reservoir elevation s = s(h)

FLOOD-ROUTING HYDROLOGICAL STORAGE ROUTING

Further, due to the Passage of the flood wave through the reservoir, the water level in the reservoir changing with time h =h (t) and hence the storage and discharge change with time required to find the variation of s, h and Q with time.

where H = head over the spill way, L= effective length of the Spill way crest and C = coefficient of discharge .

Similarly for other forms of outlets such as gated Spill ways sluice gates, etc. other relations for Q (h) will be available,

For reservoir routing, the following data have to be known:

1. Storage volume vs elevation for the reservoir:

2. Water surface  elevation  vs  outflow  and  hence  storage    outflow discharge;

3 inflow hydrograph I = I(t and

4. Initial values of S,/and Q at time: =0

There are a V of methods available for routing of floods through a reservoir. All of them  use but in various  re arranged  manners.

As the  horizontal  surface  is assumed in the reservoir, the storage routing is also known as leve1 pool routing.

HYDRAULIC METHOD FOR FLOOD ROUTING

Only for highly simplified eases can one obtain the analytical solution of these equations. The development of modern, high-speed digital computers during the past two decades has given rise to the evolution of many indicated  numerical techniques.

The  various  numerical  methods  for  solving  St.venant  equations  can  be  broadly classified into two categories:

Approximate Methods

Complete Numerical methods

These methods are based on the equation of continuity only or on a drastically curtailed equation of motion.

The hydrological method of storage routing and Muskingum channel routing belong to this category. Other methods in this category are diffusion analogy and kinematic wave models.

Complete Numerical Methods

These are the essence of the hydraulic method of routing and are classified into many categories as below:

In the direct method, the partial derivatives are replaced by finite differences and the resulting algebraic equations are then solved. In the method of characteristics (MOC)

St Venant equations are converted into a pair of ordinary differential equations (i.e. characteristic  forms) and  then  solved  by finite  difference  techniques.

In the  finite element method (FEM) the system is divided into a number of elements and partial differential equations are integrated at the nodal points of the elements.

The numerical schemes are further classified into explicit and implicit methods.

In the explicit method the algebraic equations are linear and the dependent variables are extracted explicitly at the end of each time step.

In the implicit method the dependent Variables occur implicitly and the equations are nonlinear. Each of these two methods have a host of finite- differentiating schemes to choose from.

ROUTING IN CONCEPTUAL HYDROGRAPH DEVELOPMENT

Even though the routing of floods through a reservoir or channel discuss previous section  were  developed  for  field  use,  they  have  found  another  important  in  the conceptual studies of hydrographs.

The FLOOD ROUTING through a reservoir attenuation and channel  routing  which  gives translation  to an input hydrograph  are treated as two basic modifying operators.

The following two fictitious intensities in the studies for development of synthetic hydrographs through conceptual models.

1. Linear  reservoir:  a  reservoir  in  which  the  storage  is  directly  proportional  to discharge, (S = KQ). This element is used to provide attenuation to flood wave.

2. Linear channel: a fictitious channel  in which  the  time  required  to discharge  Q through a given reach is constant. An inflow hydrograph pass through such a channel with only translation and no attenuation.

Conceptual modelling for Hill development has undergone rapid progress Since the first work by Zoch (1937). Detailed reviews of various contributions to this field are available in Refs 2 and 3 and the details are beyond the scope of this book However, a

simple method, viz, Clark’ s method (1945) which utilizes the Muskingum method of routing through a linear reservoir is indicated below as a typical example of the use of routing in conceptual models.


Routing

The linear reservoir at the outlet is assumed to be described by S = KQ, where K is the storage time constant. The value of K can be estimated by considering the point of inflection P of a surface runoff hydrograph .

At this point the inflow into the channel has ceased and beyond  this point  the flow is entirely due to withdrawal  from the channel storage, The continuity equation

Routing

where suffix i refers to the point of inflection, and K can be estimated from a known surface runoff hydrograph of the catchment

The constant K can also he estimated from the data on the recession limb of a hydrograph.

Knowing K of the linear reservoir, the inflows at various times are routed by the Muskingum  method.

Note  that  since  a  linear  reservoir  is used  .  The  inflow  rate between an inter-isochrone area A, km with a time interval   t (h) is Routing  of the time-area histogram by the above equation gives the ordinates of IUH for the catchment.

Using this IUH- any other D-h unit hydrograph can be derived.

Other links:

HYDROLOGIC CYCLE
PRECIPITATION
RAIN GAUGE
EVAPORATION
INFILTRATION
GROUNDWATER
Water Table
AQUIFER PROPERTIES
DARCY’S LAW
FLOOD FREQUENCY STUDIES
RECURRENCE INTERVAL
GUMBEL’S METHOD

Categories
Uncategorized

GUMBEL’S METHOD

GUMBEL’S METHOD

This extreme value distribution was introduced by Gumbel (1941) and is commonly  known as gumbel’s  distribution.

It  is  one  of  the  most  widely  used probability-distribution  functions for extreme values in hydrologic and meteorologic studies for  prediction of flood peaks, maximum rainfalls, maximum wind speed, etc.

Gumbel defined  a flood as the largest of the 365 daily flows and the annual series  flood  flows constitute  a series of largest  values  of flows.

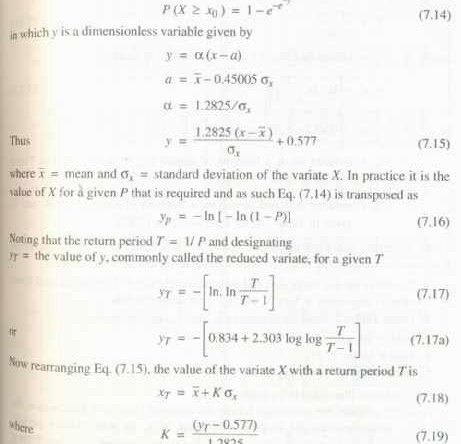
According  to his theory extreme events, the probability of occurrence of an event equal to or larger than a value x0 is

Since the practical annual data series of extreme events such as floods., maximum rainfall depths etc., all have finite lengths of record, Eq. (7.19) is modified to account for finiite N as given below for practical use.

GUMBEL’S METHOD

Gumbel Probability Paper

The  Gumbel  probability  paper  is  an  aid  for  convenient  graphical representation of Gumbel’ s distribution.

It consists of an abscissa specially marked for various  convenient values of the return period T. To construct the T scale on the abscjssa.

First construct an arithmetic scale of YT values, say from  —2 to + 7, as in Fig. 7.3. For selected values of T, say 2, 10, 50, 100,500 and 1000, find the values of YT by Equation (7.22) and mark off those positions on the abscissa. The T —scale is now ready for use (Fig. 7.3)

logarithmic scale. Since by Eqs (7.18) and (7.19) x varies linearly with yr, a Gumbel distribution will plot as a straight line on a Gumbel probability paper. This property can be used advantageously for graphical extrapolation, wherever necessary.

Other links:

HYDROLOGIC CYCLE
PRECIPITATION
RAIN GAUGE
EVAPORATION
INFILTRATION
GROUNDWATER
Water Table
AQUIFER PROPERTIES
DARCY’S LAW
FLOOD FREQUENCY STUDIES
RECURRENCE INTERVAL
FLOOD ROUTING

Categories
Uncategorized

RECURRENCE INTERVAL

RECURRENCE INTERVAL

RECURRENCE INTERVAL – In  many  hydraulic-engineering  applications  such  as  those  concerned  with floods, the probability of occurance  of  a  particular  extreme  rainfall,

e.g.  a  24-h maximum  rainfall,  will  be  of  importance.

Such  information  is  obtained  by  the frequency analysis of the point-rainfall data.

The rainfall at a place is a random hydrologic  process and the rainfall data at a place when arranged in chronological order constitute a time series.

One of the commonly used data series is the annual series composed of annual values such as annual rainfall.

If the extreme values of a specified event  occurring in each year is listed, it also constitutes an annual series.

Thus for example, one may list the maximum 24-h rainfall occurring in a year at  a  station  to  prepare  an  annual  series  of  24-h  maximum  rainfall  values.

The probability of occurrence of an event in this series is studied by frequency analysis of this annual data series.

A brief description of the terminology and a simple method of predicting the frequency of an event is described in this section and for details the reader  is referred  to standard  works  on  probability  and  statistics.

The  analysis  of annual series, even though described with rainfall as a reference is equally applicable to any other random hydrological process, e.g. stream flow.

First, it is necessary to correctly understand the terminology used in frequency analysis. The probability of occurrence of an event (e.g. rainfall) whose magnitude is equal to or in excess of a specified magnitude  X is denoted by P.

The recurrence interval (also known as return period) is defined as T=1/P

This represents the average interval between the occurrence of a rainfall of magnitude equal to or greater than X.

Thus if it is stated that the return period of rainfall of 20cm in  24  his  10  years  at  a  certain  station  A,  it  implies  that  on  an  average  rainfall magnitudes equal to or greater than 20 cm in 24 h occur once in 10 years, i.e. in a long period of say 100 years, 10 such events can be expected.

However, it does not mean that every 10 years one such event is likely, i.e. periodicity is not implied.

Then probability of a rainfall of 20 cm in 24 h occurring in any one year at station A is l/T = 1/10 = 0.1.

If the probability of an event occurring is P, the probability of the event not occurring in a given  year is q = ( 1- P).

The binomial distribution  can be used to find  the probability of occurrence of the event r times in n successive years. Thus

RECURRENCE INTERVAL

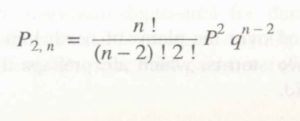
where Pr = probability of a random hydrologic event (rainfall) of given magnitude- and  exceedence  probability  P  occurring  r  times  in  n  successive  years.  Thus,  for example,

(a) The probability of an event  of exceedence probability P occurring 2 times inn successive years is

RECURRENCE INTERVAL

In  using  the  partial  duration  series,  it  is  necessary  to  establish  that  all  events considered are independent.

Hence the partial duration series is adopted mostly  for rainfall analysis where the  conditions of  independency of events are easy to establish its use in flood studies is rather.

The recurrence interval of an event obtained by 100 series (TA) and by the Partial duration ( Tp) are related by

RECURRENCE INTERVAL

Other links:

HYDROLOGIC CYCLE
PRECIPITATION
RAIN GAUGE
EVAPORATION
INFILTRATION
GROUNDWATER
Water Table
AQUIFER PROPERTIES
DARCY’S LAW
FLOOD FREQUENCY STUDIES
GUMBEL’S METHOD
FLOOD ROUTING

Categories
Uncategorized

FLOOD – FLOOD FREQUENCY STUDIES

FLOOD

A flood is an unusually high stage in a river normally the level at which the river overflows its banks and inundates the adjoining area.

The damages caused by floods  in  terms  of  loss  of  life,  property  and  economic  loss  due  to  disruption  of economic activity are all too well known.

Crores of rupees are spent every year in flood control and flood forecasting.

The hydrograph of extreme floods and stages corresponding to flood peaks provide valuable data for purposes of hydrologic design.

Further, of the various characteristics of the flood hydrograph, probably the most important and widely used parameter is the flood peak.

At a given location in a stream, flood peaks vary from year to year and their magnitude constitutes a hydrologic series which enable one to assign  a  frequency  to  a  given  flood-peak  value.

In  the  design  of  practically  all hydraulic structures the peak flow that can be expected with an assigned frequency (say 1 in 100 years) is of primary importance to adequately proportion the structure to accommodate its effect.

The design of bridges, culvert waterways and spillways for dams and estimation of scour at a hydraulic  structure are some examples  wherein flood-peak values are required.

To estimate the magnitude of a flood peak the following alternative methods are available:

Rational method, empirical method, unit-hydrograph, and flood-frequency studies.

The use of a particular method depends upon (i) the desired objective, (ii) the available data and (iii) the importance of the project.

Further the rational formula is only applicable to small site (< 50 m) catchments and the unit-hydrograph method is normally restricted to moderate size catchments with areas less than 5000 km.

FLOOD FREQUENCY STUDIES

Hydrologic processes such as floods are exceedingly complex natural events.

They  are resultants  of a number  of component  parameters  and are  therefore  very difficult, analytically.

For example, the buds in a catchment depend upon the characteristics of the catchment, rainfall and antecedent conditions, each one of these factors in turn depend upon a host of constituent parameters.

This makes the elimination of the flood peak a very complex problem leading to many different approaches.

The empirical formulae and unit-hydrograph methods presented  in  the  previous  sections  are  some  of  them.  Another  approach  to  the prediction of flood flows, and also applicable to other hydrologic processes such as rainfall etc. is the statistical method of frequency analysis.

FLOOD FREQUENCY STUDIES

The values  of the maximum  flood  from a given  catchments  area for large number    of successive  years  constitute  a  hydrologic  data  series  called  the annual series.

The  data  are  then  arranged  in  decreasing  order  of  magnitude  and  the probability  P  of  each  event  being  equaled  to  or  exceeded  (plotting  position)  is calculated by the plotting position formula

Where M = order number of the event and

N = total number of events in the data.

The recurrence  interval, T(also called the return period or frequency) is calculated as T=1/P

The last column shows the return period 1 of various flood magnitude, Q. A plot of Q vs T yields the probability distribution.

For small return periods (i.e. for interpolation) or where limited extrapolation is required, a simple best fitting curve through plotted points can be used as the probability distribution.

A logarithmic scale for T is often advantageous. However, when larger extrapolations of Tare  involved,  theoretical  probability  distributions  have  to  be  used.

In  frequency analysis of floods the usual problem is to predict extreme flood events. Towards this, specific  extreme-value  distributions  are assumed  and the required  statistical parameters calculated from the available data.

Using these  the flood magnitude for a specific return period is estimated.

Chow  (1951)  has shown that most  frequency  distribution functions applicable to hydrologic studies can be expressed by the following equation known as the general  equation of hydrologic frequency analysis:

where   x  = value of the variate X of a random hydrologic series with a return period T

x  = mean of the variate

= standard deviation of the variate

K = frequency  factor which depends upon the return period, T

and the assumed frequency  distribution.

Some of the commonly used frequency distribution function  predication of extreme flood values are

  • Gumbel’ s extreme —v alue distribution
  • Log —Pearson Type II distribution
  • Log normal distribution

Other links:

HYDROLOGIC CYCLE
PRECIPITATION
RAIN GAUGE
EVAPORATION
INFILTRATION
GROUNDWATER
Water Table
AQUIFER PROPERTIES
DARCY’S LAW
RECURRENCE INTERVAL
GUMBEL’S METHOD
FLOOD ROUTING