FLOOD
A flood is an unusually high stage in a river normally the level at which the river overflows its banks and inundates the adjoining area.
The damages caused by floods in terms of loss of life, property and economic loss due to disruption of economic activity are all too well known.
Crores of rupees are spent every year in flood control and flood forecasting.
The hydrograph of extreme floods and stages corresponding to flood peaks provide valuable data for purposes of hydrologic design.
Further, of the various characteristics of the flood hydrograph, probably the most important and widely used parameter is the flood peak.
At a given location in a stream, flood peaks vary from year to year and their magnitude constitutes a hydrologic series which enable one to assign a frequency to a given flood-peak value.
In the design of practically all hydraulic structures the peak flow that can be expected with an assigned frequency (say 1 in 100 years) is of primary importance to adequately proportion the structure to accommodate its effect.
The design of bridges, culvert waterways and spillways for dams and estimation of scour at a hydraulic structure are some examples wherein flood-peak values are required.
To estimate the magnitude of a flood peak the following alternative methods are available:
Rational method, empirical method, unit-hydrograph, and flood-frequency studies.
The use of a particular method depends upon (i) the desired objective, (ii) the available data and (iii) the importance of the project.
Further the rational formula is only applicable to small site (< 50 m) catchments and the unit-hydrograph method is normally restricted to moderate size catchments with areas less than 5000 km.
FLOOD FREQUENCY STUDIES
Hydrologic processes such as floods are exceedingly complex natural events.
They are resultants of a number of component parameters and are therefore very difficult, analytically.
For example, the buds in a catchment depend upon the characteristics of the catchment, rainfall and antecedent conditions, each one of these factors in turn depend upon a host of constituent parameters.
This makes the elimination of the flood peak a very complex problem leading to many different approaches.
The empirical formulae and unit-hydrograph methods presented in the previous sections are some of them. Another approach to the prediction of flood flows, and also applicable to other hydrologic processes such as rainfall etc. is the statistical method of frequency analysis.
The values of the maximum flood from a given catchments area for large number of successive years constitute a hydrologic data series called the annual series.
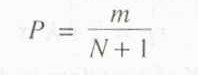
The data are then arranged in decreasing order of magnitude and the probability P of each event being equaled to or exceeded (plotting position) is calculated by the plotting position formula
Where M = order number of the event and
N = total number of events in the data.
The recurrence interval, T(also called the return period or frequency) is calculated as T=1/P
The last column shows the return period 1 of various flood magnitude, Q. A plot of Q vs T yields the probability distribution.
For small return periods (i.e. for interpolation) or where limited extrapolation is required, a simple best fitting curve through plotted points can be used as the probability distribution.
A logarithmic scale for T is often advantageous. However, when larger extrapolations of Tare involved, theoretical probability distributions have to be used.
In frequency analysis of floods the usual problem is to predict extreme flood events. Towards this, specific extreme-value distributions are assumed and the required statistical parameters calculated from the available data.
Using these the flood magnitude for a specific return period is estimated.
Chow (1951) has shown that most frequency distribution functions applicable to hydrologic studies can be expressed by the following equation known as the general equation of hydrologic frequency analysis:
where x = value of the variate X of a random hydrologic series with a return period T
x = mean of the variate
= standard deviation of the variate
K = frequency factor which depends upon the return period, T
and the assumed frequency distribution.
Some of the commonly used frequency distribution function predication of extreme flood values are
- Gumbel’ s extreme —v alue distribution
- Log —Pearson Type II distribution
- Log normal distribution
Other links:
HYDROLOGIC CYCLE
PRECIPITATION
RAIN GAUGE
EVAPORATION
INFILTRATION
GROUNDWATER
Water Table
AQUIFER PROPERTIES
DARCY’S LAW
RECURRENCE INTERVAL
GUMBEL’S METHOD
FLOOD ROUTING