GUMBEL’S METHOD
This extreme value distribution was introduced by Gumbel (1941) and is commonly known as gumbel’s distribution.
It is one of the most widely used probability-distribution functions for extreme values in hydrologic and meteorologic studies for prediction of flood peaks, maximum rainfalls, maximum wind speed, etc.
Gumbel defined a flood as the largest of the 365 daily flows and the annual series flood flows constitute a series of largest values of flows.
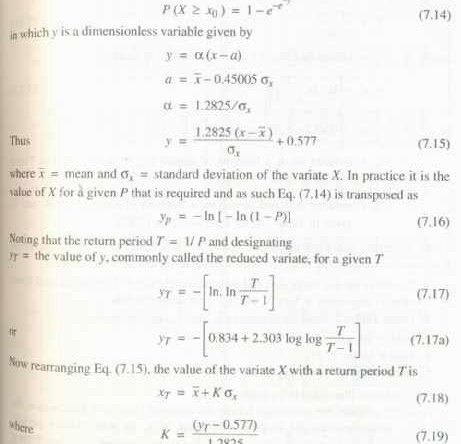
According to his theory extreme events, the probability of occurrence of an event equal to or larger than a value x0 is
Since the practical annual data series of extreme events such as floods., maximum rainfall depths etc., all have finite lengths of record, Eq. (7.19) is modified to account for finiite N as given below for practical use.

Gumbel Probability Paper
The Gumbel probability paper is an aid for convenient graphical representation of Gumbel’ s distribution.
It consists of an abscissa specially marked for various convenient values of the return period T. To construct the T scale on the abscjssa.
First construct an arithmetic scale of YT values, say from —2 to + 7, as in Fig. 7.3. For selected values of T, say 2, 10, 50, 100,500 and 1000, find the values of YT by Equation (7.22) and mark off those positions on the abscissa. The T —scale is now ready for use (Fig. 7.3)

logarithmic scale. Since by Eqs (7.18) and (7.19) x varies linearly with yr, a Gumbel distribution will plot as a straight line on a Gumbel probability paper. This property can be used advantageously for graphical extrapolation, wherever necessary.
Other links:
HYDROLOGIC CYCLE
PRECIPITATION
RAIN GAUGE
EVAPORATION
INFILTRATION
GROUNDWATER
Water Table
AQUIFER PROPERTIES
DARCY’S LAW
FLOOD FREQUENCY STUDIES
RECURRENCE INTERVAL
FLOOD ROUTING
1 reply on “GUMBEL’S METHOD”
Please ! In the text about is not the eq. (7.22) to find YT from various values of T (-2 , …..7) TO CONSTRUCT THE PROBABILITY PAPER for Gumbel