Categories
Uncategorized

Anna University Students Help Form

Anna University Students Help Form

Do you Have problem in Clearing the Anna University Semester

Then You are in the Right Place

We are here to help you

Its simple you just fill the form given below and our officials will contact you, provided you with Solution to overcome the problem.


Categories
Uncategorized

CS6801 Important Questions Multi Core Architectures and Programming Regulation 2013 Anna University

CS6801 Important Questions Multi Core Architectures and Programming

CS6801 Important Questions Multi Core Architectures and Programming Regulation 2013 Anna University free download. Multi Core Architectures and Programming CS6801 Important Questions pdf free download.

Sample CS6801 Important Questions Multi Core Architectures and Programming:

1. Difference between symmetric memory and distributed architecture.
Symmetric memory: It consists of several processors with a single physical memory shared by all processors through a shared bus.
Distributed memory:It is a form of memory architectures where the memories can be addressed as one address space.
2. What is vector instruction? CS6801 Important Questions Multi Core Architectures and Programming
These are instructions that operate on vectors rather than scalars. if the vector length is vector length, these instructions have the great virtue that a simple loop such as
For(i=0;i<n;i++)
X[i]+=y[i];
Requires only a single load, add and store for each block of vector length elements, while a conventional system requires a load, add and store for each element.
3. What are the factors to increasing the operating frequency of the processor?
(i)Memory wall
(ii)ILP wall
(iii)Power wall

10. What is called directory based? CS6801 Important Questions Multi Core Architectures and Programming
Sharing status of a block of physical memory is kept in just one location called the directory.
11. What are the issues available in handling the performance?
(i)Speedup and efficiency
(ii) Amdahl’s law
(iii)Scalability
(iv)Taking timings
12. What are the disadvantages of symmetric shared memory architecture?
(i)Complier mechanisms for transparent software cache coherence are very limited. CS6801 Important Questions Multi Core Architectures and Programming
(ii)Without cache coherence, the multiprocessor loses the advantage of being to fetch and use multiple words, such as a cache block and where the fetch data remain coherent.
13. Write a mathematical formula for speedup of parallel program.
Speedup=TserialTparallel
14. Define – False sharing
It is the situation where multiple threads are accessing items of data held on a single cache line. CS6801 Important Questions Multi Core Architectures and Programming

Subject Name Multi Core Architectures and Programming
Subject code CS6801
Regulation 2013

CS6801 Important Questions Multi Core Architectures and Programming click here to download 

CS6801 Notes Multi Core Architectures and Programming


CS6801 Syllabus Multi Core Architectures and Programmings


CS6801 Question Bank Multi Core Architectures and Programming

Categories
Uncategorized

Anna University CGPA Calculator Regulation 2013

Anna University CGPA Calculator Regulation 2013

Anna University CGPA Calculator Regulation 2013. We have Created the GPA Calculator for Each Semesters Separately in Regulation 2013 for students.

Formula Used:

The Formula used to calculate CGPA is

CGPA-Calculator-Formula 2013

where

n is number of all courses successfully cleared during the particular semester in the case of GPA

GPi is the point corresponding to the grade obtained for each course

Ci is the number of Credits assigned to the course

Grade System Followed for Regulation 2013:

Anna University has following this Grade System for Regulation 2013 Students.

Grade Grade Points Mark Range
S 10 91-100
A 9 81-90
B 8 71-80
C 7 61-70
D 6 57 – 60
E 5 50 – 56
U 0 < 50
W 0  –

A student is deemed to have passed and acquired the corresponding credits in a
particular course if he/she obtains any one of the following grades: “S”, “A”, “B”, “C”, “D”, “E”.

‘SA’ denotes shortage of attendance (as per clause 6.3) and hence prevention
from writing the end semester examination. ‘SA’ will appear only in the result sheet. “U” denotes Reappearance (RA) is required for the examination in the course. “W” denotes withdrawal from the exam for the particular course. (The grades U and W will figure both in Marks Sheet as well as in Result Sheet)

Semester 1 Regulation 2013 GPA Calculator:

Semester 2

Semester 3

Semester 4

Semester 5

Semester 6

Semester 7

Semester 8

Important Note :

To get distinction Students must get atleast  7.5 CGPA With out any history of arrears in all their semesters.

If you find any errors in Anna University CGPA Calculator Regulation 2013 please comment us below.

Categories
Uncategorized

CS6302 Database Management Systems Important questions Regulation 2013 Anna University

CS6302 Database Management Systems Important questions

CS6302 Database Management Systems Important questions Regulation 2013 Anna University free download. Database Management Systems CS6302 Important questions pdf free download.

Sample CS6302 Database Management Systems Important questions:

1. Who is a DBA? What are the responsibilities of a DBA? April/May-2011

A database administrator (short form DBA) is a person responsible for the design,
implementation, maintenance and repair of an organization’s database. They are also known by the titles Database Coordinator or Database Programmer, and is closely related to the Database Analyst, Database Modeller, Programmer Analyst, and Systems Manager. The role includes the development and design of database strategies, monitoring and improving database performance and capacity, and planning for future expansion requirements. They may
also plan, co-ordinate and implement security measures to safeguard the database (CS6302 Database Management Systems Important questions)

2. What is a data model? List the types of data model used. April/May-2011

A database model is the theoretical foundation of a database and fundamentally determines in which manner data can be stored, organized, and manipulated in a database system. It thereby defines the infrastructure offered by a particular database system. The most popular example of a database model is the relational model.
Types of data model used
 Hierarchical model
 Network model
 Relational model
 Entity-relationship
 Object-relational model
 Object model (CS6302 Database Management Systems Important questions)

3. Define database management system?

Database management system (DBMS) is a collection of interrelated data and a set of programs to access those data.

(CS6302 Database Management Systems Important questions)

Subject Name Database Management Systems
Subject code CS6302
Regulation 2013

CS6302 Database Management Systems Important questions Click here to download

CS6302 Database Management Systems Syllabus


CS6302 Database Management Systems Notes


CS6302 Database Management Systems Question Bank


Categories
Uncategorized

Uploading

TN Result Data base is Uploading Try After some time


Automobile insurance

Comparing automobile insurance quotes can facilitate purchasers purchase a regular low price motorcar insurance. Since the contract is signed, even just in case of Associate in Nursing depression, drivers won’t got to pay additional for his or her coverage. buying automobile insurance will currently be done on-line

Here, purchasers will review multiple plans in barely some minutes. The brokerage service is free and therefore the web site uses an expert computer program to assist purchasers notice the correct plans for his or her vehicles. during this means, drivers now not got to decision numerous agents or visit multiple websites.

In order to shop for Associate in Nursing advantageous coverage policy, purchasers ought to initial choose a budget. this can offer them a tenet once buying coverage. Then, they must decide what proportion coverage they require. it’s additionally necessary to notice that bound styles of automobile insurance plans offer coverage just for bound things.

Automobile insurance premiums

Knowing these necessary things before comparison motorcar insurance quotes can facilitate drivers select a coverage arrange that’s right for his or her vehicle. automobile insurance premiums are influenced by the sort of automotive that somebody drivers and by the client’s driving record. By comparison numerous automobile insurance quotes, drivers are able to scale back their coverage expenses by over V-day.

The skilled computer program permits drivers to customise their searches. they’ll select what proportion coverage they have and what form of automobile insurance they require. the web site can displays plans that ar relevant for every driver.

“In order to search out an inexpensive and advantageous automobile insurance arrange, drivers ought to compare multiple quotes. this will currently be done on one web site, in an exceedingly straightforward and convenient means.” same Russell Rabichev, selling Director of web selling Company.

There is a web supplier of life, home, health, and motorcar insurance quotes.

Why ICICI Lombard is the smart choice to secure yourself and the things you love

During FY2017, we settled 99.4 % health insurance claims and 92.2% motor insurance claims (own damage) within 30 days of claim filing.

Why Bajaj Allianz General Insurance

Surprises are an inevitable part of life – good and bad. But why deal with unpleasant surprises when you have insurance? General insurance will help you mitigate the financial losses incurred due to damage to the assets you value most. It offers you financial protection against perils faced with regards to your property, vehicle, personal accidents, health and travel. The right general insurance policy will provide you with the right protection against risks or disasters, no matter how big or small.

Why Royal Sundaram Car Insurance Policy?

Royal Sundaram is a company that is dedicated to providing you with the best there is in terms of Insurance Cover. Our Car Insurance Policy is one that not only helps you protect your vehicle but is also cash saving in nature.

Categories
Uncategorized

TamilNadu 12th Result 2018 TN HSC +2 Examination Results

TamilNadu 12th Result 2018 TN HSC +2 Examination Results

TamilNadu 12th Result 2018 TN 12th std result 2018. Tamil Nadu Students of 12th Standard can check their 12th result 2018 in this page. The DSE (Directorate of Secondary Education) of Tamil Nadu will publish the 12th std result 2018.

Tamil Nadu Higher Secondary Result 2018 will be published on May 16 of 2018.

The TN result for HSC will be published as soon as the Tamil Nadu Board release the result 2018.

TamilNadu 12th Result 2018 Date is confirmed and the count down has begin

TamilNadu 12th Result 2018:

The +2 Students are stressed because the results will published by 16th of  this month. From previous year the government of Tamil Nadu has decided not to release the rank of the students which will be continued this year (2018) too.

This is mainly done to reduce the stress of the student to score 1st 2nd 3rd Ranks in the Tamil Nadu public exam.

This process is well received by major percentage of the students. According to them this will retrieve the mental pressure by parents on them.

Few students how score high ranks are disappointed by this act of the Tamil Nadu Directorate of Secondary Education.

TamilNadu 12th Result Statics:

As per Last yesr record  8,93,262 students wrote the exam and 8,22,838 cleared the exam.

TamilNadu 12th Result 2018 TN HSC +2 Examination Results


1,123 Students got centum in Chemistry


3,361 Students got centum in Physics


3,656 Students got centum in Mathematics


221 Students got centum in Biology


8,301 Students got centum in commerce


5,597 Students got centum in accountancy


2,551 Students got centum in business mathematics


Virudhunagar District got pass percentage of 97.85%


Categories
Uncategorized

FLOOD ROUTING

FLOOD ROUTING

FLOOD ROUTING – The stage and discharge hydrographs represent the passage of waves of river depth and discharge respectively.

As this wave moves down the river, the shape of the wave gets modified due to various factors, such as channel storage, resistance, lateral addition or withdrawal of flows, etc.

When a flood wave passes through a reservoir, its peak is attenuated and the time base is enlarged due to the effect of storage.

Flood waves passing down a river have their peaks attenuated due to friction if there is no lateral inflow.

The addition of lateral inflows can cause a reduction of attenuation or even amplification of a flood wave.

Flood routing is the technique of determining the flood hydrograph at a section of a river by utilizing the data of flood flow at one or more upstream sections.

The hydrologic analysis of problems such as flood forecasting, flood protection, reservoir design  and spill design  invariably include  flood routing.

In these applications  two broad categories of routing can be recognised.

These are:

Reservoir routing

Channel routing

In reservoir routing the effect of a flood wave entering a reservoir is studied. Knowing the  volume — elevation  characteristic  of  the  reservoir  and  the  outflow — elevation relationship for the spillways and other outlet structures in the reservoir, the effect of a flood wave entering the reservoir is studied to predict the! variations of reservoir elevation and outflow discharge with time.

This form of reservoir routing is essential (i) in the design of the capacity of spill and other) reservoir outlet structures and (ii) in the location and sizing of the capacity of reservoirs to meet specific requirements.

In channel routing  the change  in the  shape  of a hydrograph  as it travels  down a channel is studied.

By considering a channel reach and an input hydrograph at the upstream end, this form of routing aims to predict the flood hydrograph at various

sections of the reach. Information on the flood-peak attenuation and the duration of levels obtained by channel routing is of utmost importance in ‘ operations and flood- protection works.

A variety of routing methods are available and they can be broadly classified into two categories as: (i) hydrologic routing and (ii) hydraulic routing. 0 methods employ essentially the equation of continuity.

Hydraulic methods, on the other hand, employ the continuity equation  together with the equation of motion of unsteady flow-

The basic  differential  equations  used  in  the  hydraulic  routing,  known  as  St.Venant equations afford a better description of flow than hydrologic methods.

HYDROLOGICAL STORAGE ROUTING (LEVELPOOL ROUTING)

A flood wave 1(t) enters a reservoir Provided with an outlet such as a spill Way T outflow is a function of the reservoir elevation only, i.e. Q =Q (h).

The Storage in the reservoir is a function of the reservoir elevation s = s(h)

FLOOD-ROUTING HYDROLOGICAL STORAGE ROUTING

Further, due to the Passage of the flood wave through the reservoir, the water level in the reservoir changing with time h =h (t) and hence the storage and discharge change with time required to find the variation of s, h and Q with time.

where H = head over the spill way, L= effective length of the Spill way crest and C = coefficient of discharge .

Similarly for other forms of outlets such as gated Spill ways sluice gates, etc. other relations for Q (h) will be available,

For reservoir routing, the following data have to be known:

1. Storage volume vs elevation for the reservoir:

2. Water surface  elevation  vs  outflow  and  hence  storage    outflow discharge;

3 inflow hydrograph I = I(t and

4. Initial values of S,/and Q at time: =0

There are a V of methods available for routing of floods through a reservoir. All of them  use but in various  re arranged  manners.

As the  horizontal  surface  is assumed in the reservoir, the storage routing is also known as leve1 pool routing.

HYDRAULIC METHOD FOR FLOOD ROUTING

Only for highly simplified eases can one obtain the analytical solution of these equations. The development of modern, high-speed digital computers during the past two decades has given rise to the evolution of many indicated  numerical techniques.

The  various  numerical  methods  for  solving  St.venant  equations  can  be  broadly classified into two categories:

Approximate Methods

Complete Numerical methods

These methods are based on the equation of continuity only or on a drastically curtailed equation of motion.

The hydrological method of storage routing and Muskingum channel routing belong to this category. Other methods in this category are diffusion analogy and kinematic wave models.

Complete Numerical Methods

These are the essence of the hydraulic method of routing and are classified into many categories as below:

In the direct method, the partial derivatives are replaced by finite differences and the resulting algebraic equations are then solved. In the method of characteristics (MOC)

St Venant equations are converted into a pair of ordinary differential equations (i.e. characteristic  forms) and  then  solved  by finite  difference  techniques.

In the  finite element method (FEM) the system is divided into a number of elements and partial differential equations are integrated at the nodal points of the elements.

The numerical schemes are further classified into explicit and implicit methods.

In the explicit method the algebraic equations are linear and the dependent variables are extracted explicitly at the end of each time step.

In the implicit method the dependent Variables occur implicitly and the equations are nonlinear. Each of these two methods have a host of finite- differentiating schemes to choose from.

ROUTING IN CONCEPTUAL HYDROGRAPH DEVELOPMENT

Even though the routing of floods through a reservoir or channel discuss previous section  were  developed  for  field  use,  they  have  found  another  important  in  the conceptual studies of hydrographs.

The FLOOD ROUTING through a reservoir attenuation and channel  routing  which  gives translation  to an input hydrograph  are treated as two basic modifying operators.

The following two fictitious intensities in the studies for development of synthetic hydrographs through conceptual models.

1. Linear  reservoir:  a  reservoir  in  which  the  storage  is  directly  proportional  to discharge, (S = KQ). This element is used to provide attenuation to flood wave.

2. Linear channel: a fictitious channel  in which  the  time  required  to discharge  Q through a given reach is constant. An inflow hydrograph pass through such a channel with only translation and no attenuation.

Conceptual modelling for Hill development has undergone rapid progress Since the first work by Zoch (1937). Detailed reviews of various contributions to this field are available in Refs 2 and 3 and the details are beyond the scope of this book However, a

simple method, viz, Clark’ s method (1945) which utilizes the Muskingum method of routing through a linear reservoir is indicated below as a typical example of the use of routing in conceptual models.


Routing

The linear reservoir at the outlet is assumed to be described by S = KQ, where K is the storage time constant. The value of K can be estimated by considering the point of inflection P of a surface runoff hydrograph .

At this point the inflow into the channel has ceased and beyond  this point  the flow is entirely due to withdrawal  from the channel storage, The continuity equation

Routing

where suffix i refers to the point of inflection, and K can be estimated from a known surface runoff hydrograph of the catchment

The constant K can also he estimated from the data on the recession limb of a hydrograph.

Knowing K of the linear reservoir, the inflows at various times are routed by the Muskingum  method.

Note  that  since  a  linear  reservoir  is used  .  The  inflow  rate between an inter-isochrone area A, km with a time interval   t (h) is Routing  of the time-area histogram by the above equation gives the ordinates of IUH for the catchment.

Using this IUH- any other D-h unit hydrograph can be derived.

Other links:

HYDROLOGIC CYCLE
PRECIPITATION
RAIN GAUGE
EVAPORATION
INFILTRATION
GROUNDWATER
Water Table
AQUIFER PROPERTIES
DARCY’S LAW
FLOOD FREQUENCY STUDIES
RECURRENCE INTERVAL
GUMBEL’S METHOD

Categories
Uncategorized

GUMBEL’S METHOD

GUMBEL’S METHOD

This extreme value distribution was introduced by Gumbel (1941) and is commonly  known as gumbel’s  distribution.

It  is  one  of  the  most  widely  used probability-distribution  functions for extreme values in hydrologic and meteorologic studies for  prediction of flood peaks, maximum rainfalls, maximum wind speed, etc.

Gumbel defined  a flood as the largest of the 365 daily flows and the annual series  flood  flows constitute  a series of largest  values  of flows.

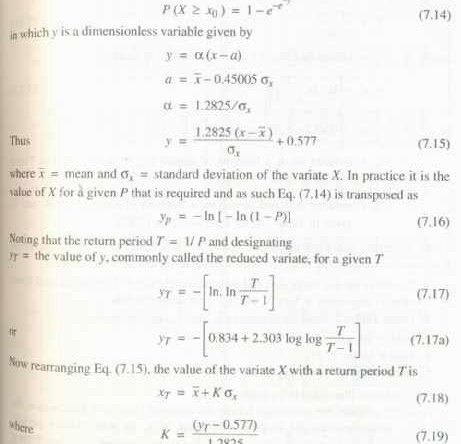
According  to his theory extreme events, the probability of occurrence of an event equal to or larger than a value x0 is

Since the practical annual data series of extreme events such as floods., maximum rainfall depths etc., all have finite lengths of record, Eq. (7.19) is modified to account for finiite N as given below for practical use.

GUMBEL’S METHOD

Gumbel Probability Paper

The  Gumbel  probability  paper  is  an  aid  for  convenient  graphical representation of Gumbel’ s distribution.

It consists of an abscissa specially marked for various  convenient values of the return period T. To construct the T scale on the abscjssa.

First construct an arithmetic scale of YT values, say from  —2 to + 7, as in Fig. 7.3. For selected values of T, say 2, 10, 50, 100,500 and 1000, find the values of YT by Equation (7.22) and mark off those positions on the abscissa. The T —scale is now ready for use (Fig. 7.3)

logarithmic scale. Since by Eqs (7.18) and (7.19) x varies linearly with yr, a Gumbel distribution will plot as a straight line on a Gumbel probability paper. This property can be used advantageously for graphical extrapolation, wherever necessary.

Other links:

HYDROLOGIC CYCLE
PRECIPITATION
RAIN GAUGE
EVAPORATION
INFILTRATION
GROUNDWATER
Water Table
AQUIFER PROPERTIES
DARCY’S LAW
FLOOD FREQUENCY STUDIES
RECURRENCE INTERVAL
FLOOD ROUTING

Categories
Uncategorized

RECURRENCE INTERVAL

RECURRENCE INTERVAL

RECURRENCE INTERVAL – In  many  hydraulic-engineering  applications  such  as  those  concerned  with floods, the probability of occurance  of  a  particular  extreme  rainfall,

e.g.  a  24-h maximum  rainfall,  will  be  of  importance.

Such  information  is  obtained  by  the frequency analysis of the point-rainfall data.

The rainfall at a place is a random hydrologic  process and the rainfall data at a place when arranged in chronological order constitute a time series.

One of the commonly used data series is the annual series composed of annual values such as annual rainfall.

If the extreme values of a specified event  occurring in each year is listed, it also constitutes an annual series.

Thus for example, one may list the maximum 24-h rainfall occurring in a year at  a  station  to  prepare  an  annual  series  of  24-h  maximum  rainfall  values.

The probability of occurrence of an event in this series is studied by frequency analysis of this annual data series.

A brief description of the terminology and a simple method of predicting the frequency of an event is described in this section and for details the reader  is referred  to standard  works  on  probability  and  statistics.

The  analysis  of annual series, even though described with rainfall as a reference is equally applicable to any other random hydrological process, e.g. stream flow.

First, it is necessary to correctly understand the terminology used in frequency analysis. The probability of occurrence of an event (e.g. rainfall) whose magnitude is equal to or in excess of a specified magnitude  X is denoted by P.

The recurrence interval (also known as return period) is defined as T=1/P

This represents the average interval between the occurrence of a rainfall of magnitude equal to or greater than X.

Thus if it is stated that the return period of rainfall of 20cm in  24  his  10  years  at  a  certain  station  A,  it  implies  that  on  an  average  rainfall magnitudes equal to or greater than 20 cm in 24 h occur once in 10 years, i.e. in a long period of say 100 years, 10 such events can be expected.

However, it does not mean that every 10 years one such event is likely, i.e. periodicity is not implied.

Then probability of a rainfall of 20 cm in 24 h occurring in any one year at station A is l/T = 1/10 = 0.1.

If the probability of an event occurring is P, the probability of the event not occurring in a given  year is q = ( 1- P).

The binomial distribution  can be used to find  the probability of occurrence of the event r times in n successive years. Thus

RECURRENCE INTERVAL

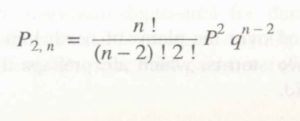
where Pr = probability of a random hydrologic event (rainfall) of given magnitude- and  exceedence  probability  P  occurring  r  times  in  n  successive  years.  Thus,  for example,

(a) The probability of an event  of exceedence probability P occurring 2 times inn successive years is

RECURRENCE INTERVAL

In  using  the  partial  duration  series,  it  is  necessary  to  establish  that  all  events considered are independent.

Hence the partial duration series is adopted mostly  for rainfall analysis where the  conditions of  independency of events are easy to establish its use in flood studies is rather.

The recurrence interval of an event obtained by 100 series (TA) and by the Partial duration ( Tp) are related by

RECURRENCE INTERVAL

Other links:

HYDROLOGIC CYCLE
PRECIPITATION
RAIN GAUGE
EVAPORATION
INFILTRATION
GROUNDWATER
Water Table
AQUIFER PROPERTIES
DARCY’S LAW
FLOOD FREQUENCY STUDIES
GUMBEL’S METHOD
FLOOD ROUTING

Categories
Uncategorized

FLOOD – FLOOD FREQUENCY STUDIES

FLOOD

A flood is an unusually high stage in a river normally the level at which the river overflows its banks and inundates the adjoining area.

The damages caused by floods  in  terms  of  loss  of  life,  property  and  economic  loss  due  to  disruption  of economic activity are all too well known.

Crores of rupees are spent every year in flood control and flood forecasting.

The hydrograph of extreme floods and stages corresponding to flood peaks provide valuable data for purposes of hydrologic design.

Further, of the various characteristics of the flood hydrograph, probably the most important and widely used parameter is the flood peak.

At a given location in a stream, flood peaks vary from year to year and their magnitude constitutes a hydrologic series which enable one to assign  a  frequency  to  a  given  flood-peak  value.

In  the  design  of  practically  all hydraulic structures the peak flow that can be expected with an assigned frequency (say 1 in 100 years) is of primary importance to adequately proportion the structure to accommodate its effect.

The design of bridges, culvert waterways and spillways for dams and estimation of scour at a hydraulic  structure are some examples  wherein flood-peak values are required.

To estimate the magnitude of a flood peak the following alternative methods are available:

Rational method, empirical method, unit-hydrograph, and flood-frequency studies.

The use of a particular method depends upon (i) the desired objective, (ii) the available data and (iii) the importance of the project.

Further the rational formula is only applicable to small site (< 50 m) catchments and the unit-hydrograph method is normally restricted to moderate size catchments with areas less than 5000 km.

FLOOD FREQUENCY STUDIES

Hydrologic processes such as floods are exceedingly complex natural events.

They  are resultants  of a number  of component  parameters  and are  therefore  very difficult, analytically.

For example, the buds in a catchment depend upon the characteristics of the catchment, rainfall and antecedent conditions, each one of these factors in turn depend upon a host of constituent parameters.

This makes the elimination of the flood peak a very complex problem leading to many different approaches.

The empirical formulae and unit-hydrograph methods presented  in  the  previous  sections  are  some  of  them.  Another  approach  to  the prediction of flood flows, and also applicable to other hydrologic processes such as rainfall etc. is the statistical method of frequency analysis.

FLOOD FREQUENCY STUDIES

The values  of the maximum  flood  from a given  catchments  area for large number    of successive  years  constitute  a  hydrologic  data  series  called  the annual series.

The  data  are  then  arranged  in  decreasing  order  of  magnitude  and  the probability  P  of  each  event  being  equaled  to  or  exceeded  (plotting  position)  is calculated by the plotting position formula

Where M = order number of the event and

N = total number of events in the data.

The recurrence  interval, T(also called the return period or frequency) is calculated as T=1/P

The last column shows the return period 1 of various flood magnitude, Q. A plot of Q vs T yields the probability distribution.

For small return periods (i.e. for interpolation) or where limited extrapolation is required, a simple best fitting curve through plotted points can be used as the probability distribution.

A logarithmic scale for T is often advantageous. However, when larger extrapolations of Tare  involved,  theoretical  probability  distributions  have  to  be  used.

In  frequency analysis of floods the usual problem is to predict extreme flood events. Towards this, specific  extreme-value  distributions  are assumed  and the required  statistical parameters calculated from the available data.

Using these  the flood magnitude for a specific return period is estimated.

Chow  (1951)  has shown that most  frequency  distribution functions applicable to hydrologic studies can be expressed by the following equation known as the general  equation of hydrologic frequency analysis:

where   x  = value of the variate X of a random hydrologic series with a return period T

x  = mean of the variate

= standard deviation of the variate

K = frequency  factor which depends upon the return period, T

and the assumed frequency  distribution.

Some of the commonly used frequency distribution function  predication of extreme flood values are

  • Gumbel’ s extreme —v alue distribution
  • Log —Pearson Type II distribution
  • Log normal distribution

Other links:

HYDROLOGIC CYCLE
PRECIPITATION
RAIN GAUGE
EVAPORATION
INFILTRATION
GROUNDWATER
Water Table
AQUIFER PROPERTIES
DARCY’S LAW
RECURRENCE INTERVAL
GUMBEL’S METHOD
FLOOD ROUTING